Market Influences You Need to Know

By Investor’s Yak

Any of these issues could cause a Monday morning market stumble:

  • Greece debt to the European Union
  • A Fourth of July terrorist attack

If Monday gets off on the right foot, here are some positive influences:

  • July starts the beginning of the third quarter which is frequently bullish
  • Window dressing from last week may have been postponed until this week
  • Action Zones are setup much better after last week’s market pullback


Market Wait

By Investor’s Yak

Wait on the market to setup; and here’s why:

  • Action Zones for the NASDAQ, S&P500, and Dow Jones are receding.
  • Greece has a June 30 deadline to pay down debt owed to the European Union.

What to do:

  • Look for the market to setup in the middle of the week.
  • July’s beginning can be positive.
  • Look for second quarter window dressing end of June beginning of July.

Volume and Volatility

By Investor’s Yak

Last week’s occurrences:

  • Thursday – New high prices achieved by the NASDAQ and Russel 2000 (small caps).
  • Friday – Major market prices pulled back on huge volume (i.e. NASDAQ, S&P500, and Dow Jones)
    The primary contributor to Friday’s volume was Quadruple Witching (contract expirations). When high volume caused by Witching events occur, it is frequently discounted to maintain a positive market outlook. But be Cautious.

Next week:

  • Greece will be in the news affecting the Euro and global reactions until their June 30 deadline to pay down debt, exit the European Union, or other market surprise.
  • “Weekly” technical analysis action zone charts shows indices are positioned to go higher in the long term. And end of the month window dressing could add to the move the following week.

Trading Continuum

By Investor’s Yak
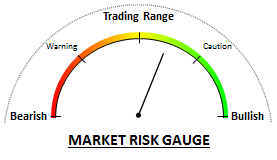
Market Risk Gauge Stage 3 Start
In the following industries, strength continues around the 50 day moving average (DMA), but remains bound by a trading range: financials (XLF), home builders (XHB), Semiconductors (SOX), and Medical (XLV, PPH, XBI, and FBT). Be cautious.

Strength has been found at the trading range lower support, which is extra strong by residing at both the 50 DMA and bottom Bollinger band. Upper trading range resistance is primarily at the top Bollinger band. These boundaries have been allowing gains of just over 2%. This can offer short term buys around the lower range and sells near the upper.

Consumer industry (XRT, and IYC) charts have been weakened with prices busting below the 50 DMA and lower Bollinger band. They are now struggling to push above the now negative sloping 50 DMA.

Negatives industries continue their weakness with 50 DMA’s remaining below their 200 DMA: Transportation (IYT), Real Estate (IYR), Energy (USO, and XLE), and Metals (GLD, SLV, PPLT, and others).

A great concern of many traders (and investors) is risk avoidance from a possible market breakdown. If the market finally busts below lower support levels (lower Bollinger band, moving average, or price support), it may be a good time to remain in cash until better support is established. Major market indexes (i.e. NASDAQ, S&P500, and Dow Jones) continue in trading ranges around the 50 DMA and have been restricting weekly boundary gains significantly.

Markets Quietly Linger

By Investor’s Yak

Positives (industries at or around the 50 DMA) include financials (XLF), home builders (XHB), Semiconductors (SOX), Medical (XLV, PPH, XBI, and FBT), and Consumers (XRT, and IYC).

Negatives (industries 50 DMA is below 200 DMA) are seen in Transportation (IYT may be ready for a price bounce), Real Estate (IYR), Energy (USO, and XLE), and Metals (GLD, SLV, PPLT, and others).

Trading ranges will probably continue into next week. Major market indexes (i.e. NASDAQ, S&P500, and Dow Jones) remain in trading ranges around the 50 day moving average (DMA). Additionally, Action Zones (AZ’s) are mixed. Small Cap (Russell 2000) and the NASDAQ weekly AZ’s reflect sufficient strength to shake off negative market influences. But DJIA and S&P500 weekly AZ charts show a pullback developing.

Future Interest rate increases could be influencing a lot of the toppy market action, but these rate increases are no surprise to the big money institutions. And summer time slowdowns, which usually catch up to the NASDAQ by the end of June, are not uncommon.

Gold is still in a trading range near the same price lows for the last 2 years. And this is even while China buying up all the gold mines. Silver and platinum are mirroring gold actions.

More of the Same

By Investor’s Yak

Major market index (i.e. NASDAQ, S&P500, and Dow Jones) activity remains mixed. They seem to be trapped between recent high prices achieved and former low price support. Trading ranges such as these can sometimes present opportunities to buy and sell over and over (buying the lower support and selling the upper high). As June begins, the summer doldrums may also set in. It could be a good time protect your profits, go on vacation, and merely peek at the markets occasionally. You decide how much risk is too much. But be careful, the news can push the market in either direction.

Memorial Day or Action Zone Influence

By Investor’s Yak

Some say a Memorial Day rally occurs the day after this holiday. And this year, it coincides with end of the month “window dressing” falling on the last day of the week. But do yourself a favor and consider the major market index (i.e. NASDAQ, S&P500, and Dow Jones) weekly and daily Action Zones.

The market appears a little mixed with daily charts looking somewhat stretched to the upside. Both the weekly and daily stochastic is already overextended and the MACD is extended beyond its Action Zone. Market pullbacks might even be on the horizon. Be cautious and consider taking you profits if things get hostile.

IY Stock List Outperforms S&P500

By Investor’s Yak

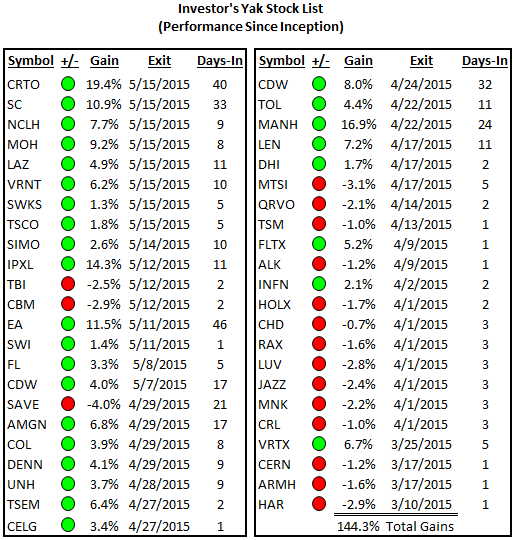
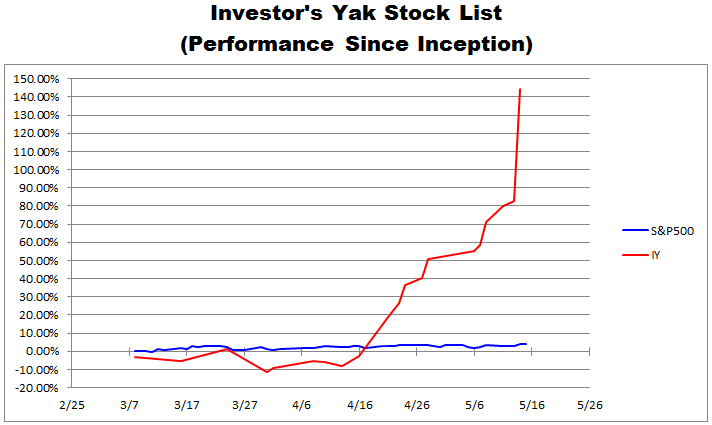
Winner stocks are typically presented in every Investor’s Yak Stock List. It is important to exit a losing trade quickly to preserve your investment capital. But it is patience and time in a winning trade that really produces great gains. Below are a graph and table, showing the cumulative gain of every stock ever published on the Investor’s Yak Stock List since its inception, with few exceptions.

IY Performance_Plot

  • All gains represent a high price that either met or exceeded the published target price prior to triggering the stop loss.
  • For consistency, the “entry” price used for gains or losses was the published Upper price. And Loss “exit” price used the published stop loss.
  • When listed stocks are published with “Caution” or as “Extended”, a purchase is not considered until Action Zone #1 is at its activated trigger point.
  • Stocks shown more than once represent a subsequent opportunity for entry.

NOTES on Stocks Omitted:

  1. Stock price never hit entry price (gapped up or price fell).
  2. Action Zone #1 changed direction before entry price hit.
  3. Stocks are not considered two to four weeks before earnings.


IY Performance_2-colmns

LAZ – Trade of the Week

By Investor’s Yak

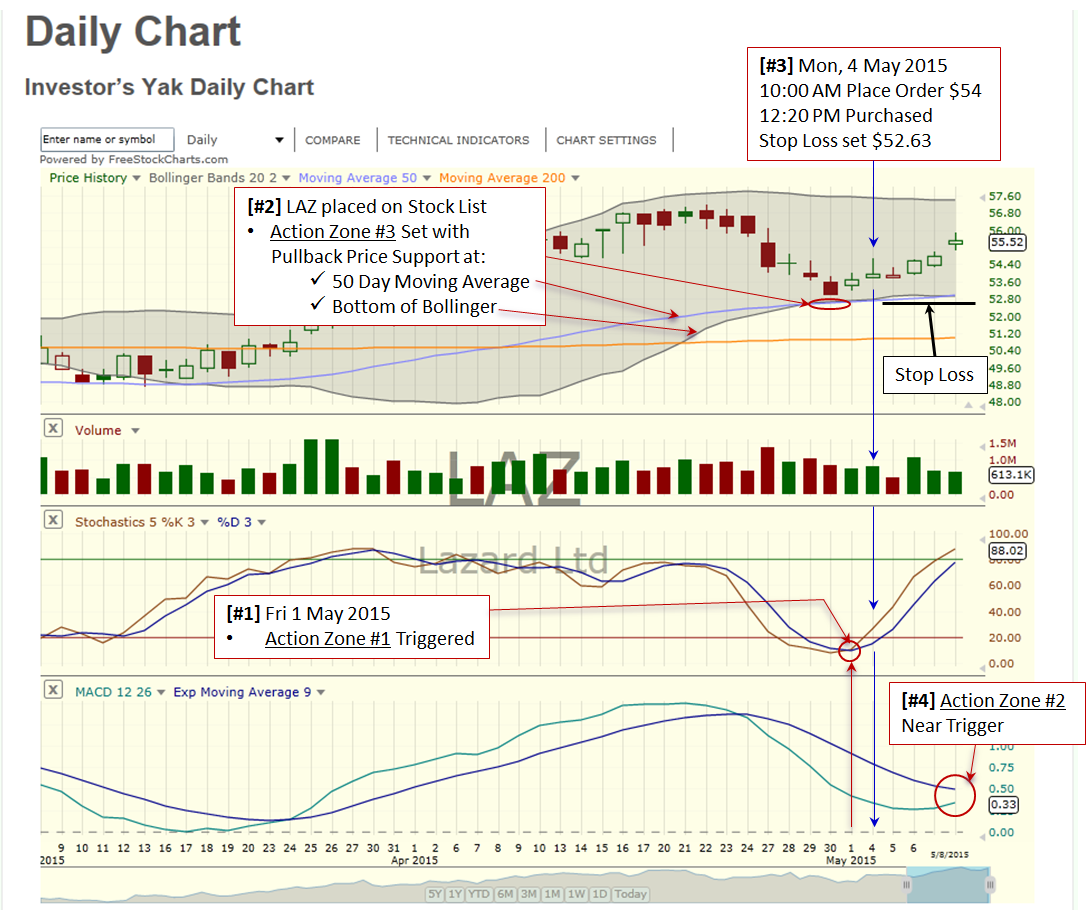
LAZ is up 2.8% in 5 days and exceeded the Investor’s Yak stock list “target price” recommended. If you took your profit, you gained more than most banks yield in an entire year. Avoid greed, and continue making solid incremental gains like this for a good end of year outcome. Notice the progression shown on the chart below:

#1 Friday May 1, 2015 Action Zone #1 Triggered and Action Zone #2 is setting up
#2 Friday May 1 2015 Action Zone #3 showed good price support
#3 Monday May 4 2015 purchase order established
#4 Action Zone #2 shows favorable move toward future trigger.

Investor’s Yak stock lists are assembled by first screening for the Action Zone #1 Stochastic, then Action Zone #2 MACD future setup, and finally distinguishing Action Zone #3 price support at major moving averages, Bollinger band bottoms, and/or prior price support.

2015-05-11_LAZ Trade of the Week

Take Investment Caution

By Investor’s Yak

Stocks bounce back last Friday after two noticeable down days. Down days stimulated by:

  • Slowing economy per poor first quarter 2015 GDP numbers
  • Fed offering no stimulus and keeping rates fixed for the weak economy

Index Status to come… determine action zone to assess.

Top