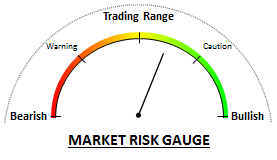
By Investor’s Yak

In the following industries, strength continues around the 50 day moving average (DMA), but remains bound by a trading range: financials (XLF), home builders (XHB), Semiconductors (SOX), and Medical (XLV, PPH, XBI, and FBT). Be cautious.
Strength has been found at the trading range lower support, which is extra strong by residing at both the 50 DMA and bottom Bollinger band. Upper trading range resistance is primarily at the top Bollinger band. These boundaries have been allowing gains of just over 2%. This can offer short term buys around the lower range and sells near the upper.
Consumer industry (XRT, and IYC) charts have been weakened with prices busting below the 50 DMA and lower Bollinger band. They are now struggling to push above the now negative sloping 50 DMA.
Negatives industries continue their weakness with 50 DMA’s remaining below their 200 DMA: Transportation (IYT), Real Estate (IYR), Energy (USO, and XLE), and Metals (GLD, SLV, PPLT, and others).
A great concern of many traders (and investors) is risk avoidance from a possible market breakdown. If the market finally busts below lower support levels (lower Bollinger band, moving average, or price support), it may be a good time to remain in cash until better support is established. Major market indexes (i.e. NASDAQ, S&P500, and Dow Jones) continue in trading ranges around the 50 DMA and have been restricting weekly boundary gains significantly.
The Blog looks more interesting with the Market Risk Gauge